Adaptive Fixed Income ETF: Trend Following Fixed Income (TFFI)
Making Fixed Income Matter Again by Adapting to All Interest Rate Environments
The Chesapeake Trend Following Fixed Income ETF (TFFI) strives to accomplish this by applying repeatable systematic investing rules to invest both long and short across four areas of the fixed income asset class:
- Sovereign duration
- Short-term rates
- Credit and spread products
- Inflation-sensitive and hybrid fixed income
TFFI’s broad global exposure and long/short flexibility allows the ETF to adjust to all market cycles and interest rate environments.
Snapshot
| Ticker | TFFI |
| Expense Ratio (%) | 1.01% |
| Inception | 02/23/2026 |
| Fund Type | Actively managed ETF |
| Exchange | NYSE |
| CUSIP | 88636X484 |
Seeks to Solve the Drawbacks of Other Fixed Income Strategies
Minimal portfolio drag during inflationary environments
Long/short flexibility allows for significant long positions during strong bond markets like 2020 but can adapt to take advantage of inflationary environments like 2022
Non-correlated returns
Seeks to make a 60/40 portfolio more resilient by providing zero to low (and sometimes negative) correlation to both equities and other long-only fixed income funds due to its ability to go long, short, or neutral across fixed income
Optimized for behavioral finance
Repeatable investing rules maintain discipline during sustained rate environments, and the application to the full spectrum of global fixed income provides flexibility to make significant allocations to stronger areas during all market cycles – a combination that removes emotion from the decision-making process, helps clients stay invested, and can lessen performance drag
Accessibility
Full liquidity and accessibility via all major custodians
Systematic Investing Process is Pure Trend Following
Portfolio Selection
Monitor a universe of fixed income futures contracts and ETFs
Determine allocations using correlation and covariance analysis
Monitor market landscape for attractive futures and ETFs to add
Entry/Exit Methodology
Position with the long-term trends, either up or down without bias
Use multiple parameters (e.g., exponential moving averages and breakouts) for each position with a range of 50-200 days
Risk Control
Apply a stop loss for each position
Limit max risk exposure at position, sector, and portfolio levels
TFFI seeks to capitalize on trends during all market cycles and rate environments due to its ability to trade both long and short across the fixed income asset class:
| Sovereign Duration |
U.S. Treasuries Developed market sovereign bonds |
| Short-Term Rates |
Policy-linked and money-market instruments Global front-end rate exposure |
| Credit & Spread Products |
Investment-grade and high-yield credit Emerging market debt and loans |
| Inflation-Sensitive & Hybrid Fixed Income |
Inflation-linked bonds Structured, securitized, and hybrid fixed income |
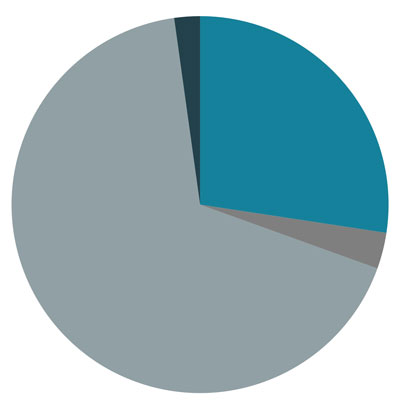
Risk Budget


Sovereign Duration
Credit & Spread Products
Inflation-Sensitive Hybrid
Short-Term Rates
ETF holdings and macro asset class allocations are subject to change.
Jerry Parker at Helm Of Portfolio Management Team
")
Jerry Parker
Parker has more than 35 years of systematic investing experience. He remains faithful to the lessons he learned during the famous Turtle Trading experiment in 1983, which was run by legendary commodity traders Bill Eckhardt and Richard Dennis.
In 1988, Parker founded Chesapeake Capital Corporation. Chesapeake is an innovative provider of systematic alternative investment solutions and has offered its strategies as limited partnerships, separately managed accounts, mutual funds, and ETFs.
Data for TFFI
Performance
Asset Allocation
Holdings
Performance
Monthly as of 05/31/2026
Quarterly as of 06/30/2026
The inception date is 02/23/2026.
The performance data quoted represents past performance. Past performance does not guarantee future results. The investment return and principal value of an investment will fluctuate so that an investor’s shares, when sold or redeemed, may be worth more or less than their original cost and current performance may be lower or higher than the performance quoted. The market price is the final price at which a security is traded on a given trading day. Net asset value (NAV) is value per share on a specific date or time. Returns less than one year are cumulative. The 30-day median bid/ask spread is a calculation expressed as a percentage rounded to the nearest hundredth. It is computed by: identifying the ETF's national best bid and national best offer as of the end of each 10 second interval during each trading day of the last 30 calendar days, dividing the difference between each such bid and offer by the midpoint of the national best bid and national best offer, and identifying the median of those values.
Asset Allocation Monthly as of 05/31/2026
Sovereign Duration
Credit & Spread Products
Short-Term Rates
Inflation-Sensitive Hybrid
ETF holdings and macro asset class allocations are subject to change.
Holdings
Holdings are subject to change.